

The recent decline in Bitcoin (BTC) has raised concerns among market participants as the largest cryptocurrency struggles to maintain its upward momentum.
With the loss of key moving averages and the $27,000 level, BTC’s sharp decline has been exacerbated by negative market sentiment and delays in the approval of spot Bitcoin Exchange-Traded Funds (ETFs) by the US Securities and Exchange Commission (SEC).
Adding to the bearish outlook is the analysis of on-chain data, which suggests a lack of strong support below the $25,400 mark.
Renowned crypto analyst Ali Martinez has emphasized this concern, highlighting the potential for a swift correction down to $23,340. However, the volatile nature of the Bitcoin market means that the outcome remains uncertain.
Bitcoin Faces Extended Downtrend
Ali Martinez’s recent post on X (formerly Twitter) has shed light on the on-chain data analysis for Bitcoin. Martinez points out that BTC is currently lacking robust support below the $25,400 level.
This observation is based on BTC’s UTxO Realized Price Age Distribution, which provides insights into different cohorts’ holding behavior by overlaying a range of realized prices along with age bands.
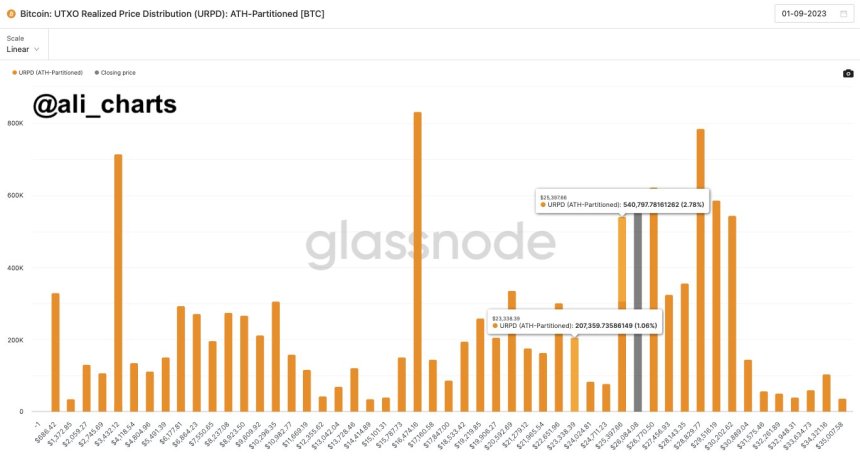
The analysis indicates a vulnerability in BTC’s price structure, suggesting that a break below the $25,400 threshold could trigger a swift correction downward to $23,340.
Moreover, the negative sentiment in the market, coupled with regulatory delays in the approval of spot Bitcoin ETFs by the SEC, has added to the bearish outlook for Bitcoin.
Many market participants had anticipated that the introduction of Bitcoin ETFs would act as a catalyst for a potential recovery in the near term. However, the prolonged delay in their approval has dampened investor sentiment and increased uncertainty surrounding the cryptocurrency’s future price trajectory.
The lack of a favorable regulatory framework has further contributed to the extended downtrend and heightened market volatility.
This said, if Bitcoin breaks below the critical support level at $25,400, as suggested by the on-chain data analysis, it could lead to a rapid correction down to $23,340. Such a significant decline would heighten concerns among investors and potentially trigger further selling pressure.
Healthy BTC Correction?
Adding to the analysis of the Bitcoin market, crypto analyst Egrag Crypto provides a broader context by highlighting the likelihood of the CME (Chicago Mercantile Exchange) gap closure and the significance of the $23,000 level as strong support.
According to Egrag Crypto, even if BTC retraces to this point, it should be seen as a natural correction within the framework of an ongoing bull market.

Egrag Crypto suggests that the CME gap closure is a phenomenon where the price of Bitcoin fills the price gap created between the closing and opening prices of the CME futures market over the weekend.
In this case, the gap exists around the $23,300 level, which indicates a potential area of strong support. This observation aligns with the notion that Bitcoin tends to fill these gaps over time.
While a retracement to $23,300 may cause concern among investors, Egrag Crypto emphasizes that it should be viewed as a healthy correction within the broader context of a bull market.
Corrections are a normal part of any market cycle, and Bitcoin has historically experienced periods of consolidation and retracement before continuing its upward trajectory.
Currently, Bitcoin is trading at $25,990, representing a 4% decline within the 24-hour period and a substantial 11% drop over the past 30 days. Despite these recent losses, the flagship cryptocurrency has successfully maintained its year-to-date gains, boasting a remarkable profit of over 29% since September 2022.
Featured image from iStock, chart from TradingView.com